
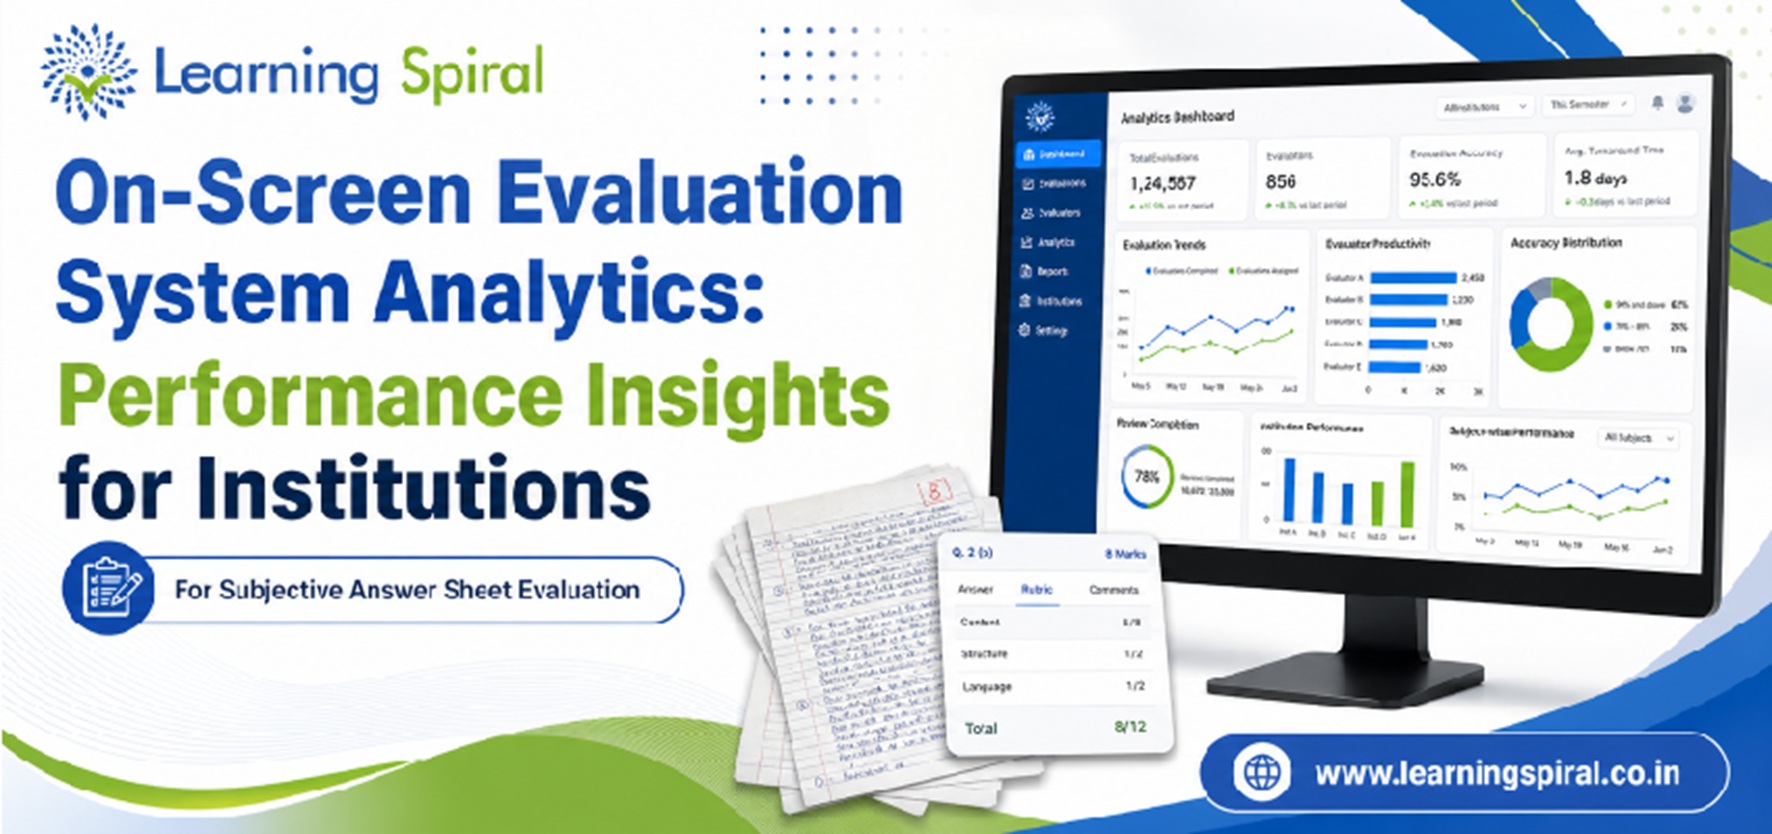
On Screen Evaluation System Analytics: 9 KPIs Every University Should Track
What if your university could identify examination delays before they affect the result declaration date?
Imagine a Controller of Examinations opening a dashboard and instantly discovering how many answer booklets have been scanned, which subjects are nearing evaluation completion, where examiner workloads are increasing, and which answer scripts still require verification.
No endless spreadsheets. No waiting for multiple departments to send separate status reports. Just a clearer picture of examination progress.
This is the value of analytics within a modern On Screen Evaluation System.
For universities and examination boards managing thousands of answer scripts, digitisation is only the beginning. The real transformation happens when examination data becomes meaningful, measurable, and actionable.
A well-structured On-Screen Evaluation workflow allows authorised evaluators to assess scanned answer booklets electronically, while examination administrators gain better visibility into the evaluation lifecycle.
But which numbers should institutions actually monitor?
Let’s explore nine essential Key Performance Indicators (KPIs) that can turn Digital Evaluation data into smarter institutional decisions.
Why Analytics Matters in an On Screen Evaluation System
Traditional examination management often relies on manual status reports, physical registers, telephone follow-ups, and scattered spreadsheets.
Although these methods may help track individual activities, they make it harder to understand the complete examination process in one place.
A modern Digital Evaluation System changes this approach by connecting operational information across answer-script scanning, examiner allocation, marking, moderation, validation, and result preparation.
Instead of simply asking whether evaluation is progressing, institutions can investigate which activities are progressing well, where additional resources may be required, and what could affect deadlines.
For example, examination administrators may want to know whether scanning is keeping pace with the receipt of answer booklets, whether certain subjects are facing longer evaluation queues, and whether completed marks are ready for result processing.
These insights transform On Screen Evaluation from an electronic marking process into a more accountable examination-management workflow.
9 Essential On-Screen Evaluation Analytics KPIs
1. Answer Booklet Scanning Completion Rate
Key question: How many expected answer booklets have been successfully digitised?
Every reliable evaluation workflow begins with accurate Answer booklet scanning.
Institutions should compare the number of expected and received answer booklets with the number successfully scanned, indexed, and verified.
The completion rate can be calculated by dividing verified scanned booklets by the total expected booklets and multiplying by 100.
However, speed alone is not enough.
The Scanning of Answer Sheets must also account for supplementary pages, barcode identification, legibility, and correct association with examination records.
An effective scanning dashboard helps administrators identify missing scripts, pending scanning batches, and reconciliation issues before they interrupt evaluation.
Institutional benefit: Better script accountability, reduced manual follow-up, and greater confidence in the digitisation process.
2. Scanning Quality and First-Pass Acceptance Rate
Key question: How many scanned booklets pass quality checks without requiring rescanning?
A high scanning completion percentage does not automatically mean that every answer script is ready for evaluation.
Blurred handwriting, incomplete pages, incorrect orientation, and damaged images may affect the examiner’s ability to assess a response.
The first-pass acceptance rate measures the percentage of scanned booklets that meet defined quality standards without corrective processing.
Institutions can also monitor rescanning frequency, image-related exceptions, and recurring issues at individual scanning locations.
Such insights help examination teams distinguish scanning productivity from scanning reliability.
Institutional benefit: More evaluation-ready scripts, fewer avoidable interruptions, and improved process consistency.
3. Evaluator Allocation and Workload Distribution
Key question: Are answer scripts being assigned efficiently and fairly?
Once answer booklets are digitised, they must be allocated to authorised evaluators according to subject expertise, examination rules, and institutional requirements.
A well-configured On-Screen Marking System should support visibility into allocated, unallocated, pending, and reassigned scripts.
Analytics may also help administrators compare workloads across examination centres, departments, and subject groups.
If one evaluator has a substantially larger pending queue than another, the institution can review allocation patterns and available capacity before deadlines are affected.
The goal is not simply to distribute equal numbers of answer scripts. Workload planning should also consider subject complexity, answer length, evaluation rules, and examiner availability.
Institutional benefit: Better resource planning, balanced evaluation workloads, and improved operational coordination.
4. Real-Time Evaluation Completion Rate
Key question: How much of the assigned evaluation work is complete?
Evaluation completion is one of the most important performance indicators within an On Screen Evaluation System.
The metric compares completed evaluations against the total number of scripts assigned for evaluation.
A dashboard can present this information at the institution, examination, subject, paper, centre, or evaluator level, depending on how the system is configured.
For example, imagine a university with 50,000 assigned answer booklets. If 35,000 have been fully evaluated, its evaluation completion rate is 70%.
This illustrative snapshot is useful, but the remaining 30% requires further analysis.
Are the pending scripts concentrated in one subject? Are moderation activities creating a queue? Are evaluators receiving newly scanned booklets later than expected?
These questions help administrators move from basic monitoring to informed decision-making.
Institutional benefit: Better deadline forecasting, early identification of pending workloads, and stronger examination progress visibility.
5. Evaluator Productivity and Throughput
Key question: How efficiently are available evaluation resources being utilised?
Evaluator throughput measures the number of answer scripts completed within a defined period, such as a working day or examination session.
It provides insight into evaluation capacity and helps administrators plan resources for examinations of different sizes.
However, evaluator productivity should not be interpreted as a simple race to mark more answer booklets.
A lengthy descriptive examination may require substantially more assessment time than a paper containing short responses.
Therefore, meaningful analytics should consider paper type, subject difficulty, evaluation length, and approved working conditions.
The purpose of productivity measurement is to identify support requirements, workload imbalances, and operational constraints—not to compromise assessment quality.
Institutional benefit: More informed workforce planning and better utilisation of examiner capacity.
6. Average Evaluation Turnaround Time
Key question: How long does an answer booklet take to move from allocation to completed marking?
Evaluation turnaround time measures the time required to complete an assigned assessment.
An institution can calculate this metric for individual scripts and analyse averages or median completion times across examinations.
For example, administrators may discover that most scripts are evaluated promptly but certain papers consistently remain pending for longer periods.
This may indicate differences in paper complexity, examiner availability, allocation scheduling, or workflow dependencies.
Tracking the age of pending scripts alongside turnaround time helps distinguish ordinary evaluation activity from emerging bottlenecks.
For a large University Examination System, this kind of visibility is especially useful when multiple examinations are being processed simultaneously.
Institutional benefit: Improved scheduling, more effective intervention, and better predictability of examination timelines.
7. Question-Wise Marking and Validation Completeness
Key question: Have all required responses been assessed and all applicable marks validated?
Accurate On Screen Marking is not only about capturing a final score.
It also requires ensuring that the required questions, sections, and marking rules have been addressed appropriately.
Digital marking workflows can support question-wise score capture, annotations, defined marking rules, and validation checks.
A useful KPI measures the proportion of completed scripts that satisfy the institution’s required marking and validation conditions.
The broader practice of On-Screen Marking forms part of electronic assessment, allowing authorised examiners to evaluate digitised responses rather than relying entirely on physical answer scripts.
Monitoring marking completeness can help examination teams identify missing marks, pending verification, and potential calculation issues before approved scores are consolidated.
Institutional benefit: Stronger quality assurance, more consistent marking workflows, and fewer avoidable post-evaluation corrections.
8. Moderation and Evaluation Exception Rate
Key question: Which scripts require additional attention before approval?
No evaluation process should assume that every completed answer script is automatically ready for final result processing.
Some scripts may require moderation, additional verification, second evaluation, or resolution of a recorded exception.
An On-Screen Evaluation System can help examination teams maintain a structured record of these activities.
A moderation or exception rate may compare the number of flagged scripts with the relevant completed evaluation population.
Administrators should distinguish routine moderation from actual marking errors. A flagged script does not necessarily indicate poor examiner performance.
By examining patterns across subjects, examination sessions, or workflow stages, institutions can improve their review procedures without drawing unfair conclusions about individual evaluators.
Institutional benefit: Better quality-control visibility, stronger traceability, and more accountable assessment decisions.
9. Result Readiness and Post-Examination Processing Time
Key question: How quickly can approved evaluation data move toward result declaration?
An examination is not administratively complete simply because every answer booklet has been marked.
Approved marks may still need verification, moderation clearance, consolidation, rule-based processing, grading, and final authorisation.
This makes result readiness a critical KPI.
Institutions can monitor the percentage of scripts or examination records that have completed the required checks and are eligible for result processing.
They can also measure the time between evaluation completion, marks approval, and final result publication.
When Post Examination Processing is connected with evaluation workflows, institutions gain a clearer understanding of what remains before results can be released.
Institutional benefit: More predictable result schedules, reduced coordination gaps, and greater administrative preparedness.
How Universities Can Turn Evaluation Data into Better Decisions
Collecting KPIs is important, but interpreting them correctly is what creates institutional value.
Consider a university with several examination departments.
One department may have completed 85% of its evaluations, while another has completed only 60%.
At first glance, the second department appears to be progressing more slowly. However, it may have received its scripts later, have fewer available evaluators, or be responsible for more complex descriptive papers.
Without this context, performance comparisons can be misleading.
A well-designed Digital Evaluation System should help administrators examine patterns rather than simply highlight isolated percentages.
Institutions should also establish clear reporting intervals, define how each KPI is calculated, and ensure that information is accessible only to authorised stakeholders.
The most useful analytics approach combines operational progress, evaluation quality, workflow accountability, and examination deadlines.
This creates a stronger foundation for decisions about staffing, scheduling, moderation, and result preparation.
Connecting Evaluation Analytics with the Complete University Examination System
Evaluation analytics becomes even more useful when it is viewed as part of the wider examination lifecycle.
Before an examination begins, Pre Examination Processing helps institutions organise candidate information, subject mapping, scheduling, and examination-related records.
Question Bank Management supports structured preparation, review, and management of examination questions.
An Online Examination System or integrated Online Exam Solution may enable institutions to conduct certain assessments digitally, while handwritten examinations can proceed through secure scanning and electronic evaluation.
In the broader context of Online Assessment, educational institutions must consider assessment methods, marking practices, and how results are interpreted.
For paper-based examinations, the journey can connect answer booklet collection, scanning, digital allocation, evaluation, moderation, and result processing.
A connected University Management System can further support coordinated academic administration when appropriate integrations are available.
The objective is to bring greater continuity to Examination Processing rather than managing each stage through isolated tools.
This also allows decision-makers to understand how activity in one department influences the next stage of the academic calendar.
How Learning Spiral Ltd. Supports Smarter Digital Evaluation
For universities and examination authorities looking to strengthen evaluation workflows, selecting suitable technology is an important step.
Learning Spiral Ltd. supports educational institutions through its digital examination and assessment solutions, including UCanEvaluate.
The platform’s documented capabilities cover answer booklet scanning, secure script management, evaluator allocation, on-screen marking, marks capture, audit and approval workflows, and reporting.
Its evaluation approach also includes features such as student identity masking, controlled authentication, custom and standard reports, and export options for Excel and PDF.
These capabilities provide a foundation for monitoring examination activities and improving administrative visibility.
Institutions planning an analytics-led deployment should discuss which dashboards, KPI calculations, reports, and integrations can be configured for their particular examination requirements.
By connecting Digital Evaluation with wider examination-management processes, Learning Spiral helps universities move toward more efficient, transparent, and manageable assessment operations.
Frequently Asked Questions
What is analytics in an On Screen Evaluation System?
Analytics refers to measuring and analysing operational information generated during digital evaluation. It can help institutions track scanning progress, evaluator allocation, completed marking, pending scripts, quality checks, and result readiness.
Which KPI is most important for university examination management?
No single KPI provides a complete picture. Evaluation completion rate, scanning quality, marking validation, and result readiness should be monitored together to understand overall progress and process reliability.
Can an On Screen Marking System help improve result timelines?
Yes. A properly configured system can reduce manual dependencies and provide better visibility into pending evaluation work. Actual timelines depend on examination volume, scanning capacity, evaluator availability, approval processes, and institutional requirements.
Can evaluation analytics help identify operational bottlenecks?
Yes. By monitoring pending queues, allocation coverage, completion patterns, and turnaround times, administrators can identify areas that may require additional resources or process adjustments.
Is On-Screen Evaluation suitable for handwritten answer booklets?
Yes. Handwritten answer scripts can be scanned, indexed, securely allocated, and digitally evaluated, provided the scanning quality and marking workflow meet the institution’s requirements.
Conclusion: From Examination Data to Institutional Intelligence
The real value of an On Screen Evaluation System extends beyond replacing physical answer-booklet checking with digital screens.
It lies in helping universities understand their examination operations more clearly.
From scanning accuracy and evaluator productivity to marking completeness and result readiness, the right KPIs give institutions a stronger basis for improving efficiency, quality, and accountability.
As higher education continues to modernise, Digital Evaluation analytics can help examination departments make better-informed decisions without losing sight of academic fairness and reliability.